Saturday, January 7, 2012

Web Malware 101

We need to understand the flow and monitor the variables in malicious browser scripts. For this Script Debuggers and Script Interpreters are necessary.

Some Open Source Tools:
Creme Brulee
Firebug – Firefox plug-in
Google Chrome Developer Tools
Javascript Deobfuscator – Firefox plug-in
JSDebug
Malzilla
Rhino
SpiderMonkey + V8
The Mina

Microsoft Tools:
Microsoft Script Debugger
Microsoft IE8 Developer Tools
Cscript and Wscript - Execute JavaScript and VBScript outside the browser.
Internet Explorer 8 comes with a powerful debugger installed.

Lets see an example of obfuscated script. The target here is Storm worm. This worm started spreading in January 2007. It used e-mail messages with subject lines about weather disasters in Europe, hence the name.

Lets inspect the javascript which has the obfuscation function shall we,


function xor_str(plain_str, xor_key)
{
var xored_str = "";
for (var i = 0 ; i < plain_str.length; ++i) xored_str += String.fromCharCode(xor_key ^ plain_str.charCodeAt(i));
return xored_str;
}

var plain_str = "\x94\xbe\xbe\xbe\xbe\xbe\xbe\xbe\xbe\xbe .... really long chars ...9d\x8f\xbe";

var xored_str = xor_str(plain_str, 180);
document.write(xored_str);

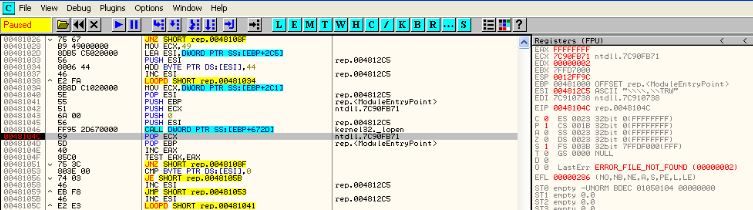
The main exploit code here is obfuscated and stored in a string variable plain_str. The code calls obfuscation function xor_str(), the output from this function is passed as input argument to document.write().  Thus to see the deobfuscated code, we will have to set a breakpoint on document.write(xored_str)  line and then examine the content of xored_str variable before it gets executed by document.write().

Malzilla
To analyze Storm we will use Malzilla. Click on the Decoder tab in Malzilla, then right click in the top frame and click 'Load  from File'. This allows you to load the malicious script into Malzilla.

Then click 'Run script' button. We can see the deobfuscated in the window below.

Sometimes there may be multiple layers of obfuscation where the first obfuscated script needs to be deobfuscated as well. In this case copy the script from the lower pane and paste it in a new tab and repeat the process.

The deobfuscated Storm script contains additional JavaScript that once executed by the victim browser will attempt to exploit an Internet Explorer vulnerability to download and execute a malicious program.


Reptile Malware - Static Analysis


You should have the following tools ready before you start this
OllyDBG
PEiD

Open Reptile in OllyDBG and we see an error message. Ignore this message and continue.Press and F8 and have a look at the things happening around OllyDBG. Keep an eye on the registers and memory for interesting strings.

After some presses of F8 the executable is terminated and it is nowhere to be found on the system. Hmmm ... this was noted in behavioral analysis when we saw CaptureBat having the executable in its deleted files. Revert back to the previous snapshot before Reptile was run in OllyDbg.

Again step through the executable by pressing F8. This time, notice some interesting strings in the ESI register:
\\.\TRW
\\.\SCIE
\\.\NTICE
\\.\FILEVXD
\\.\FILEMON
\\.\REGVXD
\\.\REGMON


Your guess is as good as mine, the executable tries to detect if there are any analysis tools present on the system. If it finds one, poof !! the executable is terminated.

On careful observation we can see that after the CALL at 481046 the value of EAX changes to FFFFFFFF. In reality EAX should change to 00000000 if it detects the presence of such tools. The check for analysis tools is broken in this executable. So lets assume that i was working, in that case EAX would have changed to 00000000.

After the CALL we can see there is a TEST EAX, EAX. if the executable find that an analysis tool exists the test will give  non-zero value and we will get an error message like this

There are a number of ways to overcome this
  • Edit the data (string)  used for the check. Example: rename Regmon to Reegmoon
  • Edit the EAX value after the CALL, make the value zero
  • Patch the Jump with a NOP or change JNZ to JE
To speed up the analysis process we would want to start analysis right from the Original Entry Point (OEP). One way in which we can land at the OEP is Section Hop. This can be done through OllyDump Plugin.
Navigate as Plugins > OllyDump > Find OEP be section Hop.

This technique mainly works by detecting when the executable switches from running code in one memory section to another. This is usually indicative of the executable unpacking itself into memory and starting to run the newly unpacked code. But for this executable this method does not seem to work =(

Another method to do the same is the SFX feature of OllyDbg. Navigate as debugging Options > SFX > Trace real entry blockwise. The other option, bytewise is slower but more accurate.

SFX (Self Extracting Executable) when enabled, OllyDbg will use memory breakpoints hoping to catch the executable code that did not exist before. That is to say, it tries to detect execution outside the original code section. For SFX to work we need to be sure that Exceptions are ignored.

When ran with SFX enabled, OllyDbg eventually pauses at 415E96. Executable is partially unpacked.


Take a snapshot at this point so that we can start the analysis from now starting at the OEP right away. As we move forward we come across another defensive mechanism. For this to activate, disable any plugin which is hiding the presence of OllyDbg.

Yes you guessed it right, it is the infamous IsDebuggerPresent mechanism. To get to this we need to go into a number of CALLS.


Go into the CALL at 412502 and we can observe below the IsDebuggerPresent.


Go through a couple of lines and there will be a number of CALLS after which the value in EAX becomes 00000001 indicating that the executable detected the presence of debugger. After this will be a test condition TEST EAX, EAX. We need to change the value in EAX to zero before this test condition. This way we can overcome the IsDebuggerPresent defensive mechanism. Of course there are plugins which handle this mechanism automatically.


Key Learnings
So in this executable we observed a number of defensive mechanisms and the ways to overcome them
  • Strings which had names of analysis tools were observed in registers
    • One way to overcome this is by changing the string in the register
  • IsDebuggerPresent check
    • This can be overcome by changing the value in EAX before the condition is tested

Reptile Malware - Behavioral Analysis


I began by having a fresh VMWare image of Windows XP. Tools which you should have ready before you start behavioral analysis:
Regshot
CaptureBat
ProcMon
ProcessExplorer
PEid

Begin by checking if ay packer is used by this malware, use PEid for this.
Shows that SVKP packer is being used here. Since a packer is being used its always good to take a snapshot before we start anything.
Packers and other protection mechanism have a long reputation of terminating the executable if it detects any analysis tools being used. To save time during analysis its good to take a snapshot just before we start the analysis.
  • Run Regshot and take the first snapshot. Second snapshot will be taken after the malware runs
  • Start Capturebat with the following switches -c-n-l > captureInfo
  • Start ProcMon
  • Start ProcessExplorer 
Run the malware for about 2 minutes and then terminate it. In this case it is not visible in ProcessExplorer. The malware might have self terminated, this is a common behavior. Take second Regshot snapshot and generate the comparison file.
Lets see the files we have obtained for analysis, check the file obtained from ProcMon. Filtering option in ProcMon is extremely helpful in analysis. I begin by using the filter "ProcessName is rep.exe" which will narrow down the activities performed by our malware.

We can see a lot of activity from the malware. I have a habit of viewing individual activities like 'File related activities' and then 'registry related activities'. This helps me focus on one kind of activity at a time.

Malware creates a Windows Service SVKP.sys. Lets check more about this services in CaptureBat analysis file. Opening this file in Excel has its advantages in terms of filtering capabilities in Excel.

When we examine the content of CaptureBat, we cant help but feel a little suspicious about the results. Oddly the file shows a very limited and subdued activity from the Malware. Also, there is no sign of SVKP service. Lets keep this in mind and work with other things that we have.

Lets see what the malware did in the Registry.
As we can see there are some entries about VMWare tools. This gives a hint that probably the Malware has capabilities to detect presence of VMWare or other Virtulization softwares. Why is this needed you ask ? This enables the malware to detect that analysts like us are studying it. So it changes its behavior when it finds this out. 

In such cases its a good idea to remove VMWare entries from the Image and try running the Malware again. We will do the same. Open the snapshot we saved before and remove VMWare entries from its registry and take another snapshot so that we can revert to this 'VMWare free' snapshot later should the need arise.

CaptureBat stores the files which may have been removed by the Malware when it runs. Lets check if CaptureBat saved any file when Reptile ran. Aha ! as we saw earlier from the ProcMon entries, it had removed the executable from the Desktop. But CaptureBat has saved this file.


Its always a good habit to check the files which the Malware may have deleted. Sometimes we may miss this information from the analysis files we captured. So lets remove VMWare Tools from the registry of our virtual image and run the malware again.


We can remove VMWare entries from the registry as shown in the image above. Once that is done lets repeat the process again with running the malware and capturing its behavior with the tools mentioned earlier.
When we check the results of the tools this time, there is a considerable increase in the activity. Another thing to notice is that the executable is not removed from the desktop. Clearly showing that the malware has the capability to detect analysis tools (mainly VMWare). We will analyze this ability of the malware in Static Analysis so be sure to check the blog entry if you are interested how the malware detects presence of VMWare. 

Checking the entries in RegShot we can see the entries modified in the registry. 


Reptile copies itself to C:\Windows\system32\SVKP.sys and win32ssr.exe.

Based on the initial behavioral findings we can say

  • Malware has capabilities to detect presence of VMWare and other analysis tools
  • Malware removes itself from the system in case it detects presence of analysis tools
  • Malware copies itself as a service and an executable on the system in C:\Windows\ folder